Wednesday, July 17, 2013

JavaScript - setTimeOut vs setInterval

With JavaScript, it is possible to execute some code at specified time-intervals. This is called timing events.
It's very easy to time events in JavaScript. The two key methods that are used are:

  • setInterval() - executes a function, over and over again, at specified time intervals
  • setTimeout() - executes a function, once, after waiting a specified number of milliseconds

Reference:

http://www.w3schools.com/js/js_timing.asp

Tuesday, July 16, 2013

Java - Memory Analyzer

A. To generate HEAP DUMP in Memory Analyzer:
Project>Run Configuration> Arguments
-XX:+HeapDumpOnOutOfMemoryError

Heap dump will be generated when the out of memory occurs

B. Use MAT to open Heap Dump


Analyzing and understanding the memory use of an application is challenging. A subtle logic error can result in listeners never being diposed, ultimately leading to the dreaded OutOfMemory error. Even if your application is properly disposing of all unused objects, you application may still be requiring 10 or 100 times more memory than necessary.
Lucky for us, the Eclipse Memory Analyzer (MAT) can help provide details of an application’s memory use. The tool is useful for both tracking memory leaks and for periodically reviewing the state of your system. In this tutorial I’ll outline 10 tips to help you use the MAT more effectively. If you’re a Java developer, the Eclipse Memory Analyzer Tool  should certainly be in your debugging toolbox.
The Memory Analyzer can be installed using the Install New Software dialog or through the Eclipse MarketPlace Client.
In this example, we are using a very simple program that allocates 100,000 Listeners, and stores them in 4 different lists. The application then sleeps without removing or clearing these lists.

1. Acquiring a memory snapshot (Heap Dump)

There are several ways you can get started with MAT. You can:
  1. Configure an application to dump the contents of its memory when an out of memory error occurs,
  2. Connect the MAT to an existing java process, or
  3. Manually acquire a heap dump and load it into the MAT
In all cases it’s important to keep in mind that this is a snapshot of memory at a point in time. The MAT cannot tell you why an object was created, nor can it show you objects that have already been garbage collected. However, if you use the MAT alongside other debugging tools and techniques, you can often conquer memory leaks pretty quickly.
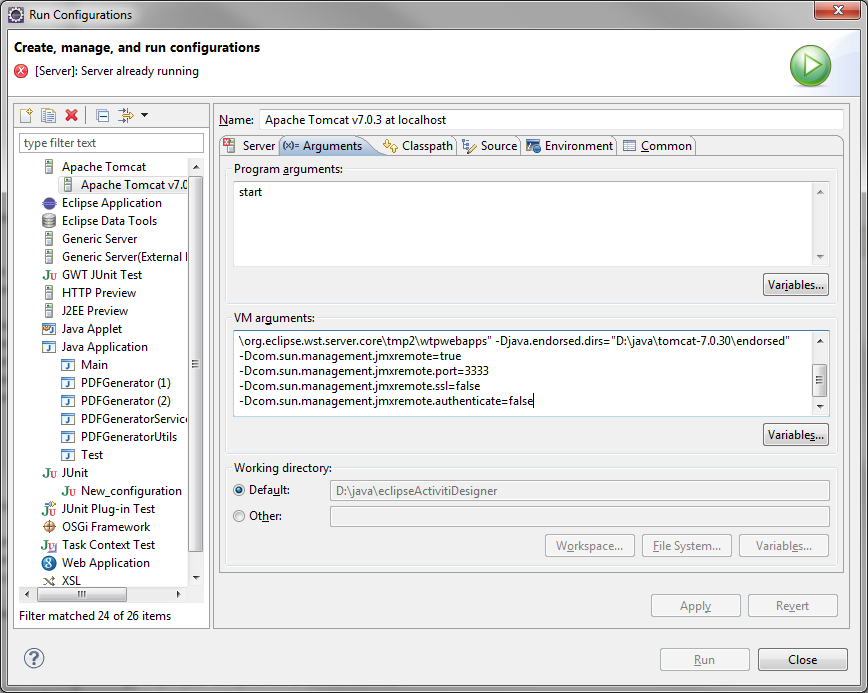
To configure your application to produce a heap dump whenever an OutOfMemory Error is thrown, add the following vm argument:
-XX:+HeapDumpOnOutOfMemoryError
Alternatively, you can use jstack to acquire a Heap dump from a currently running java process.
jmap -dump:file=heap.bin <pid>
Finally, you can use the MAT’s Acquire Heap Dump action to choose an existing Java process on your local machine.
Screen Shot 2013 01 17 at 12.08.57 PM 10 Tips for using the Eclipse Memory Analyzer
When you load a Heap dump for the first time, the MAT will index it. This make take a few minutes, but the results will be persisted so subsequent loads will be quick.

 2. Understanding the Histogram

When you first acquire your heap dump, the MAT will show you an overview of the applications memory use.
Screen Shot 2013 01 17 at 12.57.28 PM 10 Tips for using the Eclipse Memory Analyzer
The pie chart in the middle shows you the biggest objects by retained size. That means if we could dispose a particular instance of java.lang.Thread we would save 11.2Mb, and over 90% of the memory used in this application. While that might look interesting, java.lang.Thread is unlikely the real problem here. To get a better sense of what objects currently exist, you can use the Histogram.
Screen Shot 2013 01 17 at 12.59.18 PM 10 Tips for using the Eclipse Memory Analyzer
The histogram shows the number of instances of a particular class and how much memory each one uses. Of course, char[]String and Object[] are unlikely the problem. To help better organize this view, you can group by classloader or package. This will allow you to focus on your Objects.
Screen Shot 2013 01 17 at 12.27.34 PM 10 Tips for using the Eclipse Memory Analyzer
The histogram can also be filtered using a regular expression. For example, we can show only classes that match the pattern com.example.mat.*
Screen Shot 2013 01 17 at 1.01.48 PM 10 Tips for using the Eclipse Memory Analyzer
With this view, we can now start to see that 100,000 Listener Objects are alive in the system. We can also see the amount of memory each Object is using. There are two calculations, Shallow Heap and Retained Heap.  Shallow heap is the amount of memory consumed by one object. An Object requires 32 (or 64 bits, depending on the architecture) for each reference. Primitives such as integers and longs require 4 or 8 bytes, etc… While this can be interesting, the more useful metric is the Retained Heap.

3. Understanding the Retained Heap

The retained heap shows the sum of the shallow heap size of all objects that would be removed when this object is garbage collected. For example, if an ArrayListheld 100,000 items, and each item required 16 bytes, then removing the ArrayListwould free 16 x 100,000 + X, where X is the shallow size of the ArrayList. (Note: this assumes that these objects are only being referenced by the ArrayList, and not elsewhere).
The retained heap is computed by adding the size all the objects in the retained set. retained set of X is the set of objects which would be removed by the GC when X is collected.
The retained heap can be calculated in two different ways, using the quick approximation or the precise retained size.
Screen Shot 2013 01 17 at 12.38.46 PM 10 Tips for using the Eclipse Memory Analyzer
Screen Shot 2013 01 17 at 1.06.24 PM 10 Tips for using the Eclipse Memory Analyzer
By calculating the Retained Heap we can now see that com.example.mat.Controlleris holding the majority of the memory, even though it’s only 24 bytes itself. By finding a way to free up the Controller, we can certainly get our memory problem under control.

4. The Dominator Tree

The key to understanding your retained heap, is looking at the dominator tree. The dominator tree is a tree produced by the complex object graph in your system. The dominator tree allows you to identify the largest memory graphs. An Object X is said to dominate an Object Y if every path from the Root to Y must pass through X. Looking at the dominator tree for our example, we can start to see where the bulk of our memory is leaking.
Screen Shot 2013 01 17 at 1.22.02 PM 10 Tips for using the Eclipse Memory Analyzer
By looking at the dominator tree, we can easily see that it’s not thejava.lang.Thread that’s the problem, but rather the Controller and the Allocatorthat hold the memory. All 100,000 Listeners are being retained by the Controller. By either removing freeing these objects, or freeing the lists that they contain, we can likely improve our situation. There are a few useful properties of the dominator tree:
  • All Objects that belongs to a subtree of X (com.example.mat.Controller in this case) are said to be in the retained set of X
  • If X is the immediate dominator of Y (Controller is the immediate dominator of the Allocator), then the immediate dominator of X (which is java.lang.Thread in our example) also dominates Y.
  • The parent child relationship in the tree do not necessarily correspond to the relationships in the Object graph
From the Histogram you can also choose a particular class and find all the objects that dominate the instances of this class.
Screen Shot 2013 01 17 at 1.32.47 PM1 10 Tips for using the Eclipse Memory Analyzer

5. Exploring Paths to the GC Roots

Sometimes you have a large collection of Objects that you’re certain your disposing of. Finding the the dominator may help, but often you want the exact path from that Object to the roots. For example, if I now properly dispose of my Controller, then certainly my memory problem should go away,  unfortunately they didn’t.  If I now choose an instance of the Listener, and look at Paths To GC Roots, I can see that the Controller class (Note: the class, not an Object) reference to a list of Listeners. This is because one of the list was declared static.
Screen Shot 2013 01 17 at 1.54.55 PM 10 Tips for using the Eclipse Memory Analyzer
You can also explore all the incoming and outgoing references to an Object. This is very useful if you want to see all the references to a particular Object in the Object graph.

6. The ‘Inspector’

The Inspector provides detailed information about the currently selected Class or Object. In this example we can see that the currently selected ArrayList contains 100,000 elements and references an object array at memory location 0x7f354ea68.
Screen Shot 2013 01 17 at 1.37.53 PM 10 Tips for using the Eclipse Memory Analyzer
Keeping the Inspector and the Snapshot linked will provide you with important statistics about all your selections.

7. Common Memory Anti-Patterns

The MAT provides reports for common memory use anti-patterns. These can be used to get an idea of where memory leaks are occurring, or by looking for some low hanging fruit which can be cleaned up to help improve performance.
Screen Shot 2013 01 17 at 2.13.51 PM 10 Tips for using the Eclipse Memory AnalyzerThe Heap Dump Overview will show you detailed information about your Heap Dump and provide links to common tools (like the Histogram). Information such as the threads which were running, total number of Objects in the system, size of the heap, and are also shown.
Screen Shot 2013 01 17 at 2.16.30 PM 10 Tips for using the Eclipse Memory Analyzer
The Leak Suspects report displays possible memory leaks, and provides links to the tools and charts to analyze these findings.
Screen Shot 2013 01 17 at 2.18.29 PM 10 Tips for using the Eclipse Memory AnalyzerAnother common anti-pattern is the use of a large number of collections, with very few entries in each one. For example, if our listeners each had an array of notifiers (items that need to be notified of certain events), but these notifiers were only used occasionally, we would end up wasting a lot of space. The Java Collections tools can help with these problems.
Screen Shot 2013 01 17 at 2.27.19 PM 10 Tips for using the Eclipse Memory Analyzer
Screen Shot 2013 01 17 at 2.31.25 PM 10 Tips for using the Eclipse Memory Analyzer
Screen Shot 2013 01 17 at 2.28.41 PM 10 Tips for using the Eclipse Memory Analyzer
By running a Collection -> Fill Ratio Report we can see that there are 100,000 ArrayLists that are empty. If were allocated these in a lazy manner (only when needed), we would save almost 8Mb.
We can also use Collection Analysis to see array fill ratioscollection size statistics and map collision ratios.

8. Java Tools

The MAT has a number of built in tools to generate reports tailored to the details of the Java runtime. For example, the Threads and Stacks report will show details about all the treads in the system. You can see the local variables which are currently kept alive on each stack.
Screen Shot 2013 01 17 at 3.26.48 PM 10 Tips for using the Eclipse Memory Analyzer
You can Find all the Strings in the system that match a particular pattern:
Screen Shot 2013 01 17 at 3.30.49 PM1 10 Tips for using the Eclipse Memory Analyzer
Or even find Strings in the system which contain wasted space in their character arrays (often due to repeated use of substring).
Screen Shot 2013 01 17 at 4.18.14 PM 10 Tips for using the Eclipse Memory Analyzer

9. Object Query Language

As we’ve shown, the Eclipse Memory Analyzer has a lot of tools to help track both memory leaks and excessive memory use. While most memory problems can likely be addressed using the techniques described above, a Heap Dump contains much more information. The Object Query Language  (OQL) allows you to build your own reports based on the results of a Heap Dump.
The OQL is an SQL-like language. Just think of Classes as tables, Objects as rows and Fields as columns. For example. to show all Objects of typecom.example.mat.Listener, you would simply write:
select * from com.example.mat.Listener
Screen Shot 2013 01 17 at 4.23.57 PM 10 Tips for using the Eclipse Memory Analyzer
Columns can be configured using different fields, such as:
SELECT toString(l.message), l.message.count FROM com.example.mat.Listener l
Screen Shot 2013 01 17 at 4.28.07 PM 10 Tips for using the Eclipse Memory AnalyzerAnd finally, the WHERE clause can be used to specify particular criteria, such as all the Strings in the system which are not of the format “message:.*”
SELECT toString(s), s.count FROM java.lang.String s WHERE (toString(s) NOT LIKE "message.*")

Screen Shot 2013 01 17 at 4.34.53 PM 10 Tips for using the Eclipse Memory Analyzer

10. Exporting your results

The memory analyzer is a great tool for creating reports about the state of an application’s memory. A Heap Dump contains valuable information about the state of your system, and the MAT provides the tools needed to access this data. However, like with many open tools, if something is missing you’re not locked in, nor are you out of luck. With the MAT you can export your results to several different formats including HTML, CSV or even Plain Text. You can then use your favorite spreadsheet program (or your own tool) to continue your analysis.
Screen Shot 2013 01 17 at 4.39.34 PM 10 Tips for using the Eclipse Memory Analyzer
The Eclipse Memory Analyzer is a powerful tool, one all Java Developers should be familiar with. Tracking memory leaks and other memory related problems is often challenging, but hopefully with the MAT you can get to the root of your problems relatively quickly.

Reference:

Tomcat - loading additional libraries

Create Sub Folder in Tomcat Lib
Define those paths in shared.loader property of /conf/catalina.properties file.


#################
shared.loader = ${catalina.home}/lib/novell/*.jar, ${catalina.home}/lib/mail/*.jar

Java Memory Analyser

VisualVM with Tomcat

1. adding these paramater into catalina.out
set JAVA_OPTS=%JAVA_OPTS% -Dcom.sun.management.jmxremote=true
set JAVA_OPTS=%JAVA_OPTS% -Dcom.sun.management.jmxremote.port=3333
set JAVA_OPTS=%JAVA_OPTS% -Dcom.sun.management.jmxremote.ssl=false
set JAVA_OPTS=%JAVA_OPTS% -Dcom.sun.management.jmxremote.authenticate=false
2. Start Tomcat
3. Start VisualVM
cmd>visualvm --jdkhome %JAVA_HOME%
[Adding JMX Connection in VisualVM with Independent Tomcat]

4. Add JMX Connection VisualMX for WebApplication in Tomcat with Eclipse


5. VisualMX Monitoring


Java - loop to iterate over enum

public enum Direction {
   NORTH,
   NORTHEAST,
   EAST,
   SOUTHEAST,
   SOUTH,
   SOUTHWEST,
   WEST,
   NORTHWEST
}

for (Direction dir : Direction.values()) {
  // do what you want
}

Reference:
http://stackoverflow.com/questions/1104975/for-loop-to-iterate-over-enum-in-java

Thursday, July 11, 2013

Java - Bytes to Image & vice versa

package org.configurator.pdfgenerator.utils;
import java.awt.image.BufferedImage;
import java.io.ByteArrayInputStream;
import java.io.ByteArrayOutputStream;
import java.io.File;
import java.io.IOException;
import javax.imageio.ImageIO;

import org.apache.xerces.impl.dv.util.Base64;
 
 
public class SimpleConvertImage {
 public static void main(String[] args) throws IOException{
  String dirName="D:\\";
  ByteArrayOutputStream baos=new ByteArrayOutputStream(1000);
  BufferedImage img=ImageIO.read(new File(dirName,"plot.png"));
  ImageIO.write(img, "png", baos);
  baos.flush();
 
  String base64String=Base64.encode(baos.toByteArray());
  baos.close();
 
  byte[] bytearray = Base64.decode(base64String);
 
  BufferedImage imag=ImageIO.read(new ByteArrayInputStream(bytearray));
  ImageIO.write(imag, "png", new File(dirName,"snap.png"));
 }
}

Or Specific Functions

/***
  * Image 2 Byte Array
  * @param imageFile
  * @return
  *   byte[]
  */
 public static byte[] Image2Bytes(String imageFile){
  ByteArrayOutputStream baos=new ByteArrayOutputStream(1000);
  BufferedImage img;
  try {
   img = ImageIO.read(new File(imageFile));
   ImageIO.write(img, "png", baos);
   baos.flush();
   baos.close();
  } catch (IOException e) {
   // TODO Auto-generated catch block
   e.printStackTrace();
  }
  String base64String=Base64.encode(baos.toByteArray());
  return Base64.decode(base64String);
 }
 
 /****
  * Byte Array to Image
  * @param ImageBytesArray
  * @param filePathName
  * @return
  *   Image File
  */
 public static File Bytes2Image(byte[] ImageBytesArray,String filePathName){
  File imageFile = new File(filePathName);
  try {
   BufferedImage imag=ImageIO.read(new ByteArrayInputStream(ImageBytesArray));
   ImageIO.write(imag, "png", imageFile);
  } catch (IOException e) {
   // TODO Auto-generated catch block
   e.printStackTrace();
  }
  return imageFile;
 }

Reference:

http://www.programcreek.com/2009/02/java-convert-image-to-byte-array-convert-byte-array-to-image/
http://stackoverflow.com/questions/3211156/how-to-convert-image-to-byte-array-in-java

Java - Generate Image from Google Maps

Beside this API, Google Maps also provides an URL based API for extracting static Google Maps directly into desktop application, without requiring JavaScript or access keys. This API is very well explained here: http://code.google.com/apis/maps/documentation/staticmaps/index.html.

public class ImageUtils {
/**
* zoom level of the map, which determines the magnification level of the map.
* 0-21
*/
private static int zoom = 16;
/***
* scale:
* the number of pixels that are returned. scale=2 returns twice as many pixels as scale=1
*/
private static int scale = 2;
/***
* image size
* - free: 640x640
* - business: 2048x2048
*/
private static String size = "640x640";

/***
* maptype:
* roadmap, satellite, hybrid, and terrain.
*/
private static String maptype = "roadmap";

/***
* specifies whether the application requesting the static map is using a sensor to determine the user's location
*/
private static boolean sensor = false;

/***
* defines a marker of location.
* ie, color:blue, label:A
*/
private static String markers = "color:blue%7Clabel:A%7C";

public static void main(String[] args) throws IOException{
String imageFile = "d:\\plot.png";
String address = "Donaufelder straße 16, 1040 Wien, Österreich";
generateGoogleImage(address,imageFile);
}

private static File generateGoogleImage(String address,String imageFile){
address = address.replace(" ","+");
File googleImage = new File(imageFile);
try {
String addressGoogleUrl = "http://maps.googleapis.com/maps/api/staticmap?" +
    "center=" + address +
    "&zoom=" + zoom +
    "&size=" + size +
    "&scale=" + scale +
    "&maptype="+ maptype +
    "&markers=" + markers +
    address+
    "&sensor="+ sensor;

System.out.println("Address!"+"\t"+addressGoogleUrl);
   BufferedImage img = ImageIO.read(new URL(addressGoogleUrl));
   ImageIO.write(img, "png", googleImage);
   System.out.println("\n\t"+googleImage.getPath());
   } catch (Exception ex) {
        System.out.println("Error!" + ex);
   }
return googleImage;
}
}

Reference:
http://e-blog-java.blogspot.co.at/2011/12/display-static-google-maps-in-java.html

Tuesday, July 9, 2013

Monday, July 8, 2013

jQuery - serializeArray

serializeArray for uncheck checkboxes

Trick:

<input type='hidden' name='check' value='false'/>
<input type='checkbox' name='check' value='true'/>


jQuery.serializeArray();

serializeArray fieldset doesn't work in IE / Safari

Use 'form' instead of 'fieldset'


<form class="myFieldset">
        <div id="divContainer">
            <div class="anotherdiv">
            <input type="text" name="testBox1" class="aclass" />
           <select name="testSel1" class="atestclass">
               <option value="car">car</option>
                        <option value="boat">boat</option>
                        <option value="plane">plane</option>
                </select>
             </div>
         </div>
</form>
<fieldset class="submit-wrap">
    <input type="submit" name="enter" id="enter" value="Enter" />
</fieldset>


Use jQuery:

$('#enter').click(function(){
    var testForm = jQuery('form').serializeArray();
    alert(testForm);
});  


Reference:
http://stackoverflow.com/questions/14852842/jquery-serializearray-doesnt-work-in-safari
http://jsfiddle.net/pCELZ/2/

Friday, July 5, 2013

Flex - PHPEclipse Plugin

Step 1 :
             Begin the installation from the Flex Builder Help menu item.
1      
Step 2 :
             This screenshot show the screen as it initially comes up. In this case you will need to change the radio button to indicate that this is a new install.
2
Step 3 :
           This screen will vary depending on the features you have installed already. You want to click on the New Remote Site button. If you are behind a proxy and the Flex Builder install mechanism does not work, then you can download a zipped version of the update site and then click the New Local Site button instead.
3
Step 4 :
           This screen is showing the New Remote Site dialog, filled in with the correct information to install PHPEclipse
           Name : PHPEclipse 1.2.x
           URL :   http://update.phpeclipse.net/update/stable/1.2.x
 41
Step 5:
          When you first come back to this screen, if the site you added is NOT selected, be sure to select it before clicking Finish.
5
Step 6:
          This next screen shows all of the features that are available to install.
6
Step 7:
          Click the button to accept the license agreement.
7
Step 8:
          Confirm the install location
8
Step 9:
          Just a screenshot of the in-process installation.
9
Step 10:
            This screen is saying that the provider cannot be verified . Ignore that and click on Install All .Not even Eclipse.org nor IBM sign their features.

10
Step 11:
           Flex Builder needs to be restarted after installing PHPEclipse.
11
Step 12:
          Finally, after restarting Flex Builder, the first thing you will typically want to do is open the PHPEclipse perspective to check whether it is installed correctly.


12

Can't install Eclipse plug-ins | Stand-alone Flash Builder

Issue

When you try to install Eclipse plug-ins in the stand-alone version of Flash Builder, you receive the following error:
"To install or update plug-ins, you must quit Flash Builder and run with administrator privileges."

Solution

To install Eclipse plug-ins in the stand-alone version of Flash Builder with administrator privileges, follow these steps:
  • In Mac OS X and Windows XP, log in to a user account that has Administrator privileges, and then install the Eclipse plug-ins.
  • In Windows Vista and Windows 7, go to the Flash Builder installation location, right-click the Adobe Flash Builder executable and select Run as Administrator. If prompted, authenticate, and then install the Eclipse plug-ins.

Reference

http://helpx.adobe.com/flash-builder/kb/cant-install-eclipse-plug-ins.html
http://subeesh.wordpress.com/2008/11/05/installing-phpeclipse-plugin-in-flex-builder/