import com.hp.hpl.jena.rdf.model.Model;
import com.hp.hpl.jena.rdf.model.ModelFactory;
import com.hp.hpl.jena.rdf.model.Property;
import com.hp.hpl.jena.rdf.model.Resource;
import java.io.FileInputStream;
import java.util.Properties;
import org.apache.http.HttpResponse;
import org.apache.http.client.HttpClient;
import org.apache.http.client.methods.HttpGet;
import org.apache.http.impl.client.DefaultHttpClient;
public class RdfSample {
  public static Properties properties = new Properties();
  public static void main(String[] args) {
    try {
      properties.load(new FileInputStream("freebase.properties"));
      String serviceURL = "https://www.googleapis.com/freebase/v1/rdf";
      HttpClient httpclient = new DefaultHttpClient();
      String topicId = "/m/02h40lc";
      String url = serviceURL + topicId + "?key=" + properties.get("API_KEY");
      HttpGet request = new HttpGet(url);
      HttpResponse httpResponse = httpclient.execute(request);
      Model model = ModelFactory.createDefaultModel();
      model.read(httpResponse.getEntity().getContent(), null, "TURTLE");
      Resource topic = model.getResource("http://rdf.freebase.com/ns/" + topicId.substring(1).replace('/','.'));
      Property labelProperty = model.getProperty("http://www.w3.org/2000/01/rdf-schema#label");
      System.out.println(topic.getProperty(labelProperty).getString());
    } catch (Exception ex) {
      ex.printStackTrace();
    }
  }
}
Wednesday, October 30, 2013
Saturday, October 26, 2013
Friday, October 25, 2013
App Engine SDK - Google Engine
com.google.apphosting.utils.config.AppEngineConfigException: Invalid configuration
include the following chunk in your appengine-web.xml:
Source:
http://stackoverflow.com/questions/13880528/running-appengine-with-eclipse
include the following chunk in your appengine-web.xml:
<threadsafe>true</threadsafe>Source:
http://stackoverflow.com/questions/13880528/running-appengine-with-eclipse
Thursday, October 17, 2013
22 Useful Online Chart & Graph Generators
Have you ever encounter situations where you need to create a
simple yet good-looking chart, graphs or diagrams and all you have is
your browser? Charts are good and effective way to show relationship between entities but sometimes creating one can be pretty challenging especially when your favorite word processing software is not around.

In today’s post, we want to highlight some of the best web services that allow you to create various charts and graphs online on-the-fly. Most of them are easy to use and don’t you even worry about the design. Your output will be as good as what you see in the screen shots below. Full list after jump.
Rich Chart Live
Create enjoyable and captivating Flash Charts from your web browser.

DIY Chart
DIY (Do it yourself) Chart is a Web-based, simple and powerful online tool to create interactive charts and graphs from static or dynamic data which may be generated using any scripting language.

Online Chart Generator
The best online chart and graph generator tool, Generate amazing 3D graphs instantly in few seconds.

Chartle.net
Chartle.net tears down the complexity of online visualizations – offers simplicity, ubiquity and interactivity online chart generator.

ChartGo
ChartGo allows users to create charts online quickly and simply paste your data in the chart data area and hit the create chart button.

Create A Graph
You can really make a detailed graph at Create A Graph and see how it might look, and then print, download, or email what you’ve created.

JS Charts
JS Charts is a JavaScript chart generator that requires little or no coding. JS Charts allows you to easily create charts in different templates like bar charts, pie charts or simple line graphs.

Pie Chart Tool
Pie Chart Tool creates a pie charts based on the data you provide. All you have to do is to type your data and the name of the categories.

Piecolor
Piecolor is a tool that creates pie chart with colors very easily.

Hohli Charts
Hohli Charts lets you dynamically generate charts.

CSS Chart Generator
CSS Chart Generator generates your charts on the fly.

CHARTPART
Google chart API and chart generator tool.

Chart Maker
Generator for the Chart Server API.

Google Chart Tools
The Google Chart Tools enable adding live charts to any web page.

amCharts Visual Editor
This editor allows you to use amCharts as a web service. This means that all you need to do is to configure the chart and paste the generated HTML code to your HTML page.

Pie Chart Maker
This free tool outputs your pie chart as an image that you can save to your computer.

ChartGizmo
With your free account from ChartGizmo you can now create charts for your website, blog and social network profiles.

Onlinecharttool.com
On Onlinecharttool.com you can design and share your own graphs online and for free.

OWTChart Generator
The OWTChart Generator is an on-line tool to be used to produce charts. A GIF image of the chart that you specified will be displayed on the screen.

Highcharts
Highcharts is a charting library written in pure JavaScript, offering an easy way of adding interactive charts to your web site or web application. Highcharts currently supports line, spline, area, areaspline, column, bar, pie and scatter chart types.

iCharts
iCharts is a web-services company that makes data publishing and distribution simple.

Google Chart Generator
Create a Google chart in seconds!

Source:
http://www.hongkiat.com/blog/22-useful-chart-graph-diagram-generators/
In today’s post, we want to highlight some of the best web services that allow you to create various charts and graphs online on-the-fly. Most of them are easy to use and don’t you even worry about the design. Your output will be as good as what you see in the screen shots below. Full list after jump.
Rich Chart Live
Create enjoyable and captivating Flash Charts from your web browser.
DIY Chart
DIY (Do it yourself) Chart is a Web-based, simple and powerful online tool to create interactive charts and graphs from static or dynamic data which may be generated using any scripting language.
Online Chart Generator
The best online chart and graph generator tool, Generate amazing 3D graphs instantly in few seconds.
Chartle.net
Chartle.net tears down the complexity of online visualizations – offers simplicity, ubiquity and interactivity online chart generator.
ChartGo
ChartGo allows users to create charts online quickly and simply paste your data in the chart data area and hit the create chart button.
Create A Graph
You can really make a detailed graph at Create A Graph and see how it might look, and then print, download, or email what you’ve created.
JS Charts
JS Charts is a JavaScript chart generator that requires little or no coding. JS Charts allows you to easily create charts in different templates like bar charts, pie charts or simple line graphs.
Pie Chart Tool
Pie Chart Tool creates a pie charts based on the data you provide. All you have to do is to type your data and the name of the categories.
Piecolor
Piecolor is a tool that creates pie chart with colors very easily.
Hohli Charts
Hohli Charts lets you dynamically generate charts.
CSS Chart Generator
CSS Chart Generator generates your charts on the fly.
CHARTPART
Google chart API and chart generator tool.
Chart Maker
Generator for the Chart Server API.
Google Chart Tools
The Google Chart Tools enable adding live charts to any web page.
amCharts Visual Editor
This editor allows you to use amCharts as a web service. This means that all you need to do is to configure the chart and paste the generated HTML code to your HTML page.
Pie Chart Maker
This free tool outputs your pie chart as an image that you can save to your computer.
ChartGizmo
With your free account from ChartGizmo you can now create charts for your website, blog and social network profiles.
Onlinecharttool.com
On Onlinecharttool.com you can design and share your own graphs online and for free.
OWTChart Generator
The OWTChart Generator is an on-line tool to be used to produce charts. A GIF image of the chart that you specified will be displayed on the screen.
Highcharts
Highcharts is a charting library written in pure JavaScript, offering an easy way of adding interactive charts to your web site or web application. Highcharts currently supports line, spline, area, areaspline, column, bar, pie and scatter chart types.
iCharts
iCharts is a web-services company that makes data publishing and distribution simple.
Google Chart Generator
Create a Google chart in seconds!
Source:
http://www.hongkiat.com/blog/22-useful-chart-graph-diagram-generators/
Wednesday, October 16, 2013
SPARQL in Android
Using ARQoid for Android-based SPARQL Query Execution
I was recently asked about the SPARQL support in Sparql Droid
and whether it could serve as a way for other Android applications to
execute SPARQL queries against remote data sources. It could be used in
this way but there is a simpler alternative I’d like to discuss here.
On the Android platform it is actually quite easy to execute SPARQL
against remote SPARQL endpoints, RDF data and local models. The heavy
lifting is handled by Androjena’s ARQoid, an Android-centric port of HP’s Jena ARQ engine.Both engines (the original and the port) do a great job of simplifying the execution of SPARQL queries and consumption of the resulting data. In this post I’ll go through a simple example of using ARQoid. Note that all the code being shown here is available for download. This post is based specifically on the queryRemoteSparqlEndpoint() method in the com.monead.androjena.demo.arqoid.SparqlExamples class.
Setup
To begin, some environment setup needs to be done in order to have a properly configured Android project ready to use ARQoid.First, obtain the ARQoid JAR and its dependencies. This is easily accomplished using the download page on the ARQoid Wiki and obtaining the latest ARQoid ZIP file. Unzip the downloaded archive. Since I’m discussing an Android application I’d expect that you would have created an Android project and that it contains a libs directory where the JAR files should be placed.
Second, add the JAR files to the classpath for your Android project. I use the ADT plugin for Eclipse to do Android development. So to add the JARs to my project I choose the Project menu item, select Properties, choose Build Path, select the Libraries tab, click the Add JARs… button, navigate to the libs directory, select the JAR files and click OK on the open dialogs.
Third, setup a minimal Android project. The default layout, with a small change to its definition will work fine.
Overview
Now we are ready to write the code that uses ARQoid to access some data. For this first blog entry I’ll focus on a trivial query against a SPARQL endpoint. There would be some small differences if we wanted to query a local model or a remote data set. Those will be covered in follow-on entries.Here is a list of the ARQoid classes we will be using for this initial example:
- com.hp.hpl.jena.query.Query – represents the query being executed
- com.hp.hpl.jena.query.Syntax – represents the query syntaxes supported by ARQoid
- com.hp.hpl.jena.query.QueryFactory – creates a Query instance based on supplied parameters such as the query string and syntax definition
- com.hp.hpl.jena.query.QueryExecution – provides the service to execute the query
- com.hp.hpl.jena.query.QueryExecutionFactory – creates a QueryExecution instance based on supplied parameters such as a Query instance and SPARQL endpoint URI
- com.hp.hpl.jena.query.ResultSet – represents the returned data and metadata associated with the executed query
- com.hp.hpl.jena.query.QuerySolution – represents one row of data within the ResultSet.
The query we will execute is:
SELECT ?dataType ?data
WHERE {
  <http://nasa.dataincubator.org/launch/1961-012> ?dataType ?data.
}
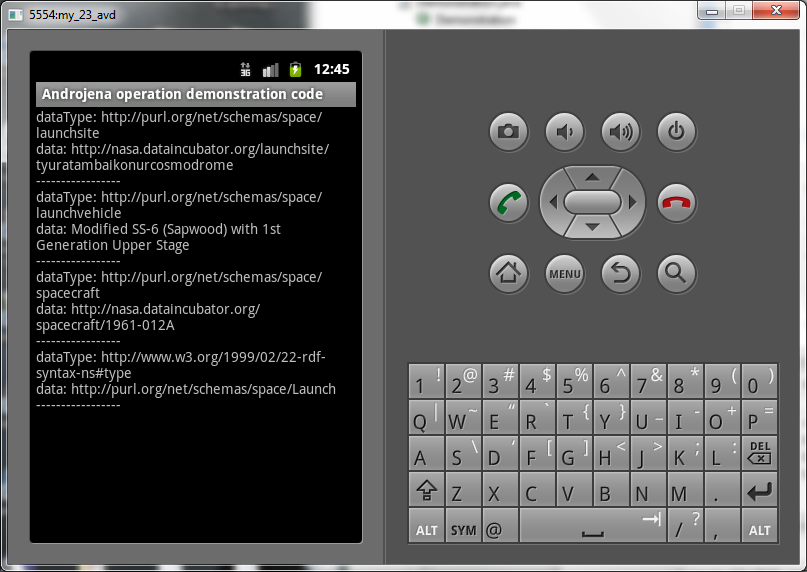
This query will give us a little information about Vostok 1 launched by the USSR in 1961.Create the Query instance
We begin by creating the Query instance using the QueryFactory.// Create a Query instance Query query = QueryFactory.create(queryString, Syntax.syntaxARQ);This code assumes that the query given earlier has been assigned to the String variable queryString
Create the QueryExecution instance
We next create a QueryExecution using the QueryExecutionFactory.// This query uses an external SPARQL endpoint for processing // This is the syntax for that type of query QueryExecution qe = QueryExecutionFactory.sparqlService(sparqlEndpointUri, query);This code assumes that the Talis endpoint mentioned above has been assigned to the String variable sparqlEndpointUri.
Execute the query and obtain the ResultSet instance
We are now ready to actually execute the query and obtain the ResultSet instance.// Execute the query and obtain results ResultSet resultSet = qe.execSelect();The resultSet variable now provides us access to the query results.
Retrieve the column names
A useful piece of metadata in the ResultSet instance is the list of column names. These will be based on the information requested in the SELECT clause. ARQoid can return them as a List<String>.// Get the column names (the aliases supplied in the SELECT clause) List<String> columnNames = resultSet.getResultVars();The columnNames List will contain the aliases given in the SELECT clause.
Iterate through the resulting rows
We can now iterate through the resulting rows, asking for each row’s data which is represented as a QuerySolution instance.// Iterate through all resulting rows
while (resultSet.hasNext()) {
// Get the next result row
QuerySolution solution = resultSet.next();
The solution variable will contain the current result row’s data.Obtain the data for a row and column
To actually access the data you can request a specific column name from the QuerySolution instance. However, you need to know whether the data is null, a literal value or a URI. The following code performs the necessary tests and then prints the data to the standard output (in the downloadable code it will be presented on the Android device’s screen).// Data value will be null if optional and not present
if (solution.get(var) == null) {
System.out.println("{null}");
// Test whether the returned value is a literal value
} else if (solution.get(var).isLiteral()) {
System.out.println (solution.getLiteral(var).toString());
// Otherwise the returned value is a URI
} else {
System.out.println(solution.getResource(var).getURI());
}
From the code, above, you can see that in order to access the basic data value you use the get(String) method which expects the column name to be passed. This will return null if there is no data associated with this row and column. If there is a value, the method isLiteral()
may be called to test whether the data is a literal. If it is not than
it will likely be a URI. The URI can be accessed by calling the getResource(String) method, passing the column name, and calling the getURI() method on that value.Close the QueryExecution instance
The last step is important. The QueryExecution instance should be cleaned up by calling its close() method.// Important - free up resources used running the query qe.close();These are the basic steps you need to carry out in order to execute a SPARQL query against a SPARQL endpoint using ARQoid. Here is a screen shot of the Android emulator executing the example just covered.
Notes
A few other items for completeness. First, remember to add the INTERNET permission to your Android manifest (<uses-permission android:name=”android.permission.INTERNET”/>). Failure to do so will lead to an ARQoid failure when it tries to access the remote endpoint. The stack trace will indicate a failure to access the URI – it won’t mention that there is a permission issue.Also, depending on your query, you may be trying to access a lot of data which could be time consuming and also could cause issues with small memory devices. You may limit the number of rows returned and set a starting row for the results. This allows you to create a sliding window in your application by only pulling a few results and then allowing the user to ask for more. These values are set on the Query instance. Once you have the Query from the QueryFactory you can use these methods.
// Limit the number of results returned
// Setting the limit is optional - default is unlimited
query.setLimit(10);

// Set the starting record for results returned
// Setting the limit is optional - default is 1 (and it is 1-based)
query.setOffset(11);
The limit and offset given above would cause ARQoid to return 10 records, starting with the 11th one found. If there were fewer than 11 results then no records would be returned.
Conclusion
Hopefully if you are trying to use ARQoid this will give you a quick template to leverage the basic features of the engine. In the future I’ll expand on this by adding other data sources as well as using the URIs returned by the query to create a richer result for the user.Remember that you may download the sample code if you want to see the working Android demonstration application described here. Also, you can install Sparql Droid which contains a variety of sample SPARQL queries that use the local model, SPARQL endpoints, RDF data sources as well as demonstrating federated queries.
If you have questions or comments about this topic please add them to this post or send them to me via my contact page.
Source:
http://monead.com/blog/?p=1420
http://answers.semanticweb.com/questions/21688/running-sparql-queries-on-android
http://code.google.com/p/android-sparql/wiki/Deploying_a_SPARQL_Endpoint_and_Populating_the_triple_store
http://oro.open.ac.uk/32335/1/